
Software
Advanced Software & Modeling for Precision Gas Analysis
KASSAY offers powerful software and modeling solutions for advanced gas analysis and monitoring. RMMSoft provides automated, continuous monitoring with patented analysis algorithms and integrated hardware control, while PEAK Spectroscopy delivers research-grade spectral analysis and data manipulation tools. KASSAY’s open-path dispersion modeling combines FTIR and UV measurements with meteorological data to characterize gas plumes and determine emission rates, total fluxes, and downwind impacts.
RMMSoft
a mature and powerful analysis program
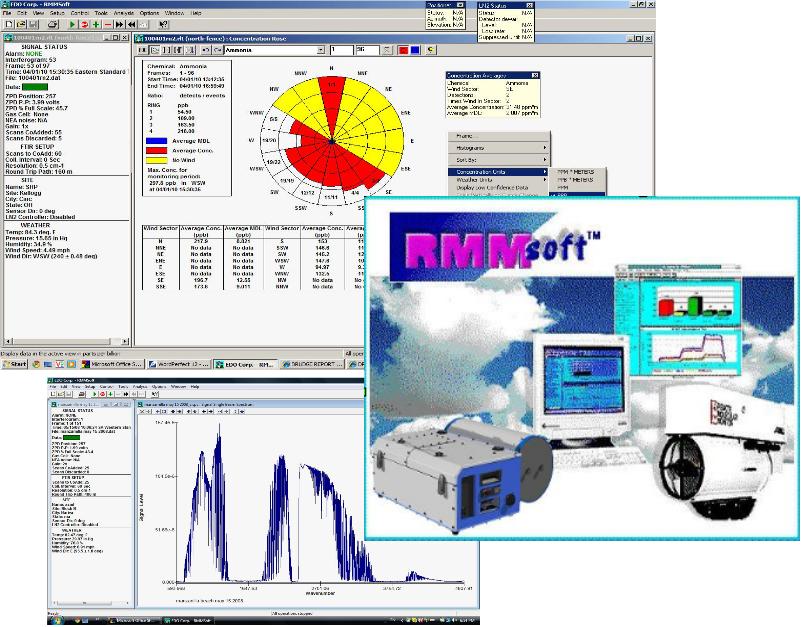
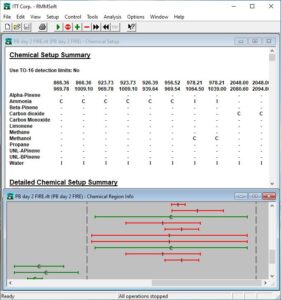
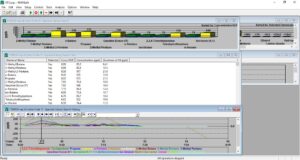
RMMSoft is a robust analysis program with patented algorithms for quantifying chemicals in spectra from RAM2000 spectrometers. It is designed for continuous, unattended gas monitoring and is ETV accredited for fence line and industrial process gas monitoring. RMMSoft operates as a stand-alone console program. Customers appreciate the seamless control of hardware and software through the console. Optional accessories like the autopositioner, LN2 auto-fill, weather station, and FTIR are managed via program servers. RMMSoft processes data independently, without relying on third-party embedded algorithms. For unattended use, it supports alarms with yellow and red warning thresholds. Technicians can collect and process data using simple toolbar menus, while scientists can display and manipulate interferograms, single beams, and absorbance spectra.
RMMSoft Specifications
Integrated servers control hardware accessories:
• FTIR spectrometer
▪ Auto positioner for directing the IR beam to multiple retro- reflectors
• Meteorological Sensors for integrating weather and FTIR data
• Liquid Nitrogen Controller (LN2) for autofilling of detector dewar
Analytical algorithms are user selectable or automatic:
▪ Adaptive background filtering
▪ Target chemical (spectral) subtraction
▪ Spectral line position alignment
▪ Spectral library searches
▪ Iterative (Io) reprocessing
▪ NEA noise calculations for each frame
▪ Programmable macros
Data Quantitation and Presentation:
▪ Fully adjustable graphics displays: 3D, % of alarm, concentrations & history
▪ MDLs can be presented as sigma values or by USEPA Compendium Method TO-16
▪ User-determined warning and trigger alarms
▪ Concentration averaging for separate time frames
▪ Emissions modeling using tracer ratio technique
▪ Integration of meteorological and spectral resuts (pollution rose)
▪ QA/QC cylinder gas calibration menu
▪ Selectable concetration units
▪ Reports generation for export to spreadsheets
▪ Spectral export in SPC format
▪ Unknown spectral search algorithm
MS windows XP, 10, 11.


PEAK Spectroscopy
A POWERFUL NEXT GENERATION SPECTRAL SOFTWARE
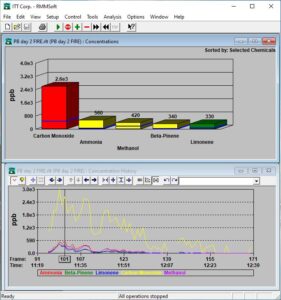
PEAK Spectroscopy is a powerful next generation software used to control KASSAY RAM2000 spectrometers for clients needing research-level spectral manipulation. Peak Spectroscopy is a Python powered spectral collection and analysis software with interactive data manipulation tools.
Designed for customers with research applications that may require spectral smoothing, baselien correction, normalization, subtraction etc. PEAK Spectroscopy has tools for file conversions, spectral overlays and view manipulation, library searches, and many more. Peak is 21 CFR Part 11 Compliant.
PEAK Spectroscopy Specifications
https://www.peakspectroscopy.com/index.html
Spectral Manipulations
Peak® Spectroscopy features fast, interactive data manipulations. Results are shown immediately while changing parameters. Infinite-level Undo lets you back out of any manipuations
- Zap (line-out) spectral regions, with zeros or interpolated lines, with the capability of adding noise back into the zapped regions
- Manual Baseline Correction with user-specified baselines
- Automatic Baseline Correction
- X-Axis Shift and Stretch
- Ratio spectra
- FFT: Fast Fourier Transform of interferograms, with control over zero-filling, apodization and phase correction
- Convert data between Absorbance, Transmittance, and Reflectance units of measure
- 5 to 99 point smoothing, with Savitsky-Golay, moving average, Hannig and Hamming window methods
- Savitksy-Golay derivatives
- Interpolate / Decimate to change the resolution of the spectral data
- Manual Interactive Spectral Subtraction
- Automatic Spectral Subtraction optimized over a user-selected region
- Offset data by a constant
- Scale data by a constant
- Truncate to change the spectral data limits
- Kramers-Kroning transform using the Maclaurin method
- Raman Shift correction: with user supplied excitation frequency
- Advanced ATR Correction: corrects for dispersion and depth of penetration
- Normalizations: Normalize the data to a minimum, a range, or using Vector Normalization
- Normalize to Peak®: make the height of a peak in all spectra the same.
- Match spectra: set a group of spectra to have the same starting and ending values and number of data points


Dispersion Models for Open Path
Combining chemical concentrations with local meteorlogical measurements

For 30 years, KASSAY has been a world leading pioneer in the use of open path measurement data in combination with dispersion modeling to determine emission rates, total fluxes, and downwind impact. Open path data measurements using (FTIR & UV) will provide a continuous total concentration along an entire beam path. The resulting path averaged concentration is advantageous to best characterize a gas plume and project emission rates and fluxes.
Specifications of Dispersion Modeling for Open Path
Air / VOC Emission and Flux Software used for research, health & safety, and regulatory compliance.
Also see Tracer Ratio Technique
Also see Radial Plume Mapping
Also see Steady State Gaussian Dispersion
Also see Inverse Steady State
Also see Non-Steady State Dispersion


